
Page 5 - Cannabis for the Management of Pain: Assessment of Safety Study
P. 5
Ware et al The Journal of Pain 1237
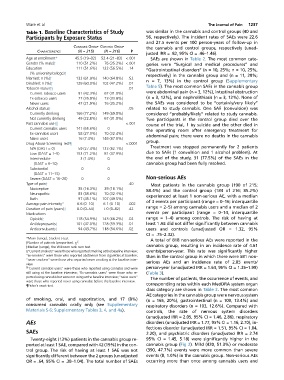
Table 1. Baseline Characteristics of Study was similar in the cannabis and control groups (40 and
Participants by Exposure Status 56, respectively). The incident rates of SAEs were 22.6
and 27.5 events per 100 person-years of follow-up in
CANNABIS GROUP CONTROL GROUP the cannabis and control groups, respectively (unad-
CHARACTERISTICS (N = 215) (N = 216) P
justed IRR = .82, 95% CI = .46–1.46).
Age at enrollment* 45.5 (19–82) 52.4 (21–83) <.001 SAEs are shown in Table 2. The most common cate-
Gender (% male)y 110 (51.2%) 76 (35.2%) <.001 gories were ‘‘Surgical and medical procedures’’ and
Education 111 (51.6%) 122 (56.5%) .14
‘‘Gastrointestinal disorders’’ (n = 10, 25%; n = 10, 25%,
(% university/college)y
respectively) in the cannabis group and (n = 11, 20%;
Married; n (%)y 133 (61.9%) 140 (64.8%) .52 n = 7, 13%) in the control group (Supplementary
Disabled; n (%)y 129 (60.0%) 102 (47.2%) .01
Table 5). The most common SAEs in the cannabis group
Tobacco statusyx .01
Current tobacco users 91 (42.3%) 67 (31.0%) were abdominal pain (n = 3, 12%), intestinal obstruction
Ex-tobacco users 77 (35.8%) 73 (33.8%) (n = 3, 12%), and nephrolithiasis (n = 3, 12%). None of
Never users 47 (21.9%) 76 (35.2%) the SAEs was considered to be ‘‘certainly/very likely’’
Alcohol statusy .05 related to study cannabis. One SAE (convulsion) was
Currently drinking 166 (77.2%) 149 (69.0%) considered ‘‘probably/likely’’ related to study cannabis.
Not currently drinking 49 (22.8%) 67 (31.0%) Two participants in the control group died over the
Past cannabis useyk <.001 course of the trial, 1 by suicide and the other died in
Current cannabis users 141 (65.6%) 0
the operating room after emergency treatment for
Ex-cannabis users 58 (27.0%) 70 (32.4%) abdominal pain; there were no deaths in the cannabis
Naive users 16 (7.4%) 146 (67.6%)
group.
Drug Abuse Screening Test{ <.0001
N/A (DAST = 0) 59 (27.4%) 133 (62.1%) Treatment was stopped permanently for 2 patients
Low (DAST = 1–5) 153 (71.2%) 81 (37.9%) due to SAEs (1 convulsion and 1 alcohol problem). At
Intermediate 3 (1.4%) 0 the end of the study, 31 (77.5%) of the SAEs in the
(DAST = 6–10) cannabis group had been fully resolved.
Substantial 0 0
(DAST = 11–15)
Severe (DAST = 16–20) 0 0 Non-serious AEs
Type of painy .40
Most patients in the cannabis group (190 of 215;
Nociceptive 35 (16.3%) 39 (18.1%) 88.4%) and the control group (184 of 216; 85.2%)
Neuropathic 83 (38.6%) 70 (32.4%)
experienced at least 1 non-serious AE, with a median
Both 97 (45.1%) 107 (49.5%)
Average pain intensity* 6.6 (0–10) 6.1 (0–10) .002 of 3 events per participant (range = 0–16; interquartile
range = 2–5) among cannabis users and a median of 2
Duration of pain (years)z 8.0 (0–54) 7.0 (0–82) .42
Medications events per participant (range = 0–14, interquartile
Opioidsy 118 (54.9%) 143 (66.2%) .02 range = 1–4) among controls. The risk of having at
Antidepressantsy 101 (47.0%) 128 (59.3%) .01 least 1 AE did not differ significantly between cannabis
Anticonvulsantsy 94 (43.7%) 118 (54.6%) .02 users and controls (unadjusted OR = 1.32, 95%
CI = .75–2.32).
*Mean (range), Student t-test. A total of 818 non-serious AEs were reported in the
2
yNumber of patients (proportion), c .
zMedian (range), the Wilcoxon rank sum test. cannabis group, resulting in an incidence rate of 4.61
x‘‘Current smokers’’ were those who reported smoking at the baseline interview; events/person-year. This rate was significantly higher
‘‘ex-smokers’’ were those who reported abstinence from cigarettes at baseline; than in the control group in which there were 581 non-
‘‘never smokers’’ were those who reported never smoking at the baseline inter-
view. serious AEs and an incidence rate of 2.85 events/
k ‘‘Current cannabis users’’ were those who reported using cannabis and were person-year (unadjusted IRR = 1.64, 95% CI = 1.35–1.99)
still using at the baseline interview; ‘‘Ex-cannabis users’’ were those who re- (Table 3).
ported using cannabis but were not using at the baseline interview; ‘‘naive users’’ The number of patients, the occurrence of events, and
were those who reported never using cannabis before the baseline interview.
{Fisher’s exact test. corresponding rates within each MedDRA system organ
class category are shown in Table 3. The most common
AE categories in the cannabis group were nervous system
of smoking, oral, and vaporization, and 17 (8%) (n = 165, 20%), gastrointestinal (n = 109, 13.4%) and
consumed cannabis orally only (see Supplementary respiratory disorders (n = 103, 12.6%). Compared with
Materials S-6; Supplementary Tables 3, 4, and 4a). controls, the rate of nervous system disorders
(unadjusted IRR = 2.05, 95% CI = 1.46, 2.86), respiratory
AEs disorders (unadjusted IRR = 1.77, 95% CI = 1.16, 2.70), in-
fections disorder (unadjusted IRR = 1.51, 95% CI = 1.04,
SAEs 2.20), and psychiatric disorders (unadjusted IRR = 2.74
Twenty-eight (13%) patients in the cannabis group re- 95% CI = 1.45, 5.18) were significantly higher in the
ported at least 1 SAE, compared with 42 (19%) in the con- cannabis group (Fig 2). Mild (420, 51.3%) or moderate
trol group. The risk of having at least 1 SAE was not (390, 47.7%) events were more common than severe
significantly different between the 2 groups (unadjusted events (8, 1.0%) in the cannabis group. Non-serious AEs
OR = .64, 95% CI = .38–1.04). The total number of SAEs occurring more than once among cannabis users and