
Page 7 - Cannabis for the Management of Pain: Assessment of Safety Study
P. 7
Ware et al The Journal of Pain 1239
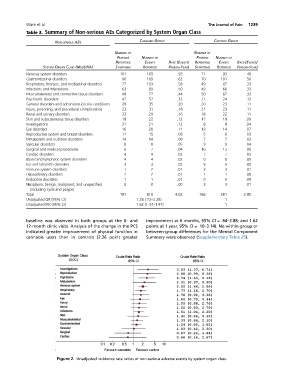
Table 3. Summary of Non-serious AEs Categorized by System Organ Class
NON-SERIOUS AEs CANNABIS GROUP CONTROL GROUP
NUMBER OF NUMBER OF
PERSONS NUMBER OF PERSONS NUMBER OF
REPORTING EVENTS RATE (EVENTS/ REPORTING EVENTS RATE (EVENTS/
SYSTEM ORGAN CLASS (MEDDRA) SYMPTOMS REPORTED PERSON-YEAR) SYMPTOMS REPORTED PERSON-YEAR)
Nervous system disorders 101 165 .93 71 93 .46
Gastrointestinal disorders 66 109 .62 70 101 .50
Respiratory, thoracic, and mediastinal disorders 77 103 .58 49 67 .33
Infections and infestations 63 89 .50 49 68 .33
Musculoskeletal and connective tissue disorders 49 77 .44 50 67 .33
Psychiatric disorders 47 57 .32 21 24 .12
General disorders and administration site conditions 29 35 .20 20 23 .11
Injury, poisoning, and procedural complications 23 31 .18 21 23 .11
Renal and urinary disorders 23 29 .16 18 22 .11
Skin and subcutaneous tissue disorders 18 22 .12 17 18 .09
Investigations 21 21 .12 8 8 .04
Eye disorders 16 20 .11 13 14 .07
Reproductive system and breast disorders 11 15 .08 5 6 .03
Metabolism and nutrition disorders 14 14 .08 7 7 .03
Vascular disorders 8 8 .05 9 9 .04
Surgical and medical procedures 6 7 .04 10 12 .06
Cardiac disorders 4 4 .02 7 7 .03
Blood and lymphatic system disorders 4 4 .02 0 0 .00
Ear and labyrinth disorders 3 3 .02 5 5 .02
Immune system disorders 1 2 .01 3 3 .01
Hepatobiliary disorders 2 2 .01 1 1 .00
Endocrine disorders 1 1 .01 0 0 .00
Neoplasms benign, malignant, and unspecified 0 0 .00 3 3 .01
(including cysts and polyps)
Total 191 818 4.62 186 581 2.85
Unadjusted OR (95% CI) 1.28 (.72–2.28) 1
Unadjusted IRR (95% CI) 1.62 (1.34–1.97) 1
baseline was observed in both groups at the 6- and improvement at 6 months, 95% CI = .84–3.88; and 1.62
12-month clinic visits. Analysis of the change in the PCS points at 1 year, 95% CI = .10–3.14). No within-group or
indicated greater improvement of physical function in between-group differences for the Mental Component
cannabis users than in controls (2.36 point greater Summary were observed (Supplementary Table 25).
Figure 2. Unadjusted incidence rate ratios of non-serious adverse events by system organ class.